 NERC Data Catalogue Service
1500 urn:ogc:def:uom:EPSG::9001
Type of resources
Topics
Keywords
Contact for the resource
Provided by
Years
Formats
Representation types
Update frequencies
Resolution
-
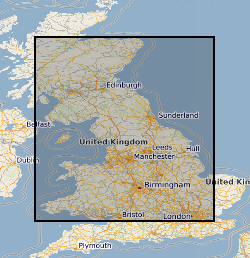
THIS DATASET HAS BEEN WITHDRAWN **This dataset was created for the "Britain beneath our feet" atlas using information extracted from the Geochemical Baseline Survey Of The Environment (G-BASE) For The UK . For Fluoride in Stream Water data please see Geochemical Baseline Survey Of The Environment (G-BASE) For The UK ** Geochemical Baseline Survey of the Environment (G-BASE) coverage for Fluoride in stream water. The G-BASE programme involves systematic sampling and the determination of chemical elements in samples of stream sediment, stream water and, locally, soil, to build up a picture of the surface chemistry of the UK. The average sample density for stream sediments and water is about one site per 1.5-2km square. Analytical precision is high with strict quality control to ensure countrywide consistency. Results have been standardised to ensure seamless joins between geochemical sampling campaigns. The data provide baseline information on the natural abundances of elements, against which anomalous values due to such factors as mineralisation and industrial contamination may be compared. Published in Britain beneath our feet atlas.
-
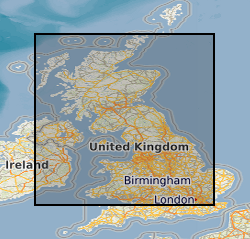
THIS DATASET HAS BEEN WITHDRAWN **This dataset was created for the "Britain beneath our feet" atlas using information extracted from the Geochemical Baseline Survey Of The Environment (G-BASE) For The UK . For Copper in Stream Sediment data please see Geochemical Baseline Survey Of The Environment (G-BASE) For The UK ** Geochemical Baseline Survey Of The Environment (G-BASE) coverage for copper in stream sediment. The G-BASE programme involves systematic sampling and the determination of chemical elements in samples of stream sediment, stream water and, locally, soil, to build up a picture of the surface chemistry of the UK. The average sample density for stream sediments and water is about one site per 1.5-2km square. Analytical precision is high with strict quality control to ensure countrywide consistency. Results have been standardised to ensure seamless joins between geochemical sampling campaigns. The data provide baseline information on the natural abundances of elements, against which anomalous values due to such factors as mineralisation and industrial contamination may be compared. Published in Britain beneath our feet atlas.
-
Data were collected in 2015, 2016 and 2017 to provide Digital Surface Models (DSM) for two sections of the South Saskatchewan River, Canada. DSMs were generated using aerial plane images with a 0.06m ground resolution, captured at a height of c. 1500 m from a fixed-wing aeroplane with an UltraCamXp sensor. DSMs were generated as part of NERC project NE/L00738X/1. DSMs were constructed using imagery obtained on four occasions (13th May 2015; 2nd Sept 2016; 8th June 2017; and 12th June 2017). The dataset consists of eight DSMs; one for each of the two river sections on each of the four dates. Full details about this dataset can be found at https://doi.org/10.5285/13695138-227f-4d85-9049-0a9cba9e1867
-
This dataset contains modelled vegetation carbon output from the land surface model JULES, along with the temperature and rainfall outputs (which were originally inputted) at a monthly, 1.5km resolution. There are four different JULES simulations, using two different climate projections (global climate sensitivity of 3.5K and highest global climate sensitivity of 7.1K) under a constant, present day atmospheric CO2 and a CO2 pathway that follows the SRES (Special Report on Emissions Scenarios) A1B scenario. Full details about this dataset can be found at https://doi.org/10.5285/f493ad5c-585c-475d-a374-2f77b5866bc4
-
The dataset contains model output from the land surface model JULES and the econometric agricultural land use model ECO-AG, at kilometre scale resolution over Great Britain for 8 different scenarios using unmitigated climate change. Modelled arable area, net primary productivity, runoff and irrigation demand are provided for scenarios combining and isolating the effects of climate, CO2 and irrigation. The driving climate data used to drive the models is from Regional Climate Model runs performed for the period 1998-2008 and for an eleven year period at 2100 for CO2 levels corresponding to the unmitigated Regional Concentration Pathway RCP8.5. Full details about this dataset can be found at https://doi.org/10.5285/2efac82b-2438-4806-999d-374663210c34